Specifically designed for marine applications
EASy is an advanced, PC-based geographical information system designed for the storage, integration, analysis, dynamic display, and dissemination of spatially referenced series of diverse oceanographic data. It has been used in a range of national and international oceanographic projects.
Sharing projects on the web
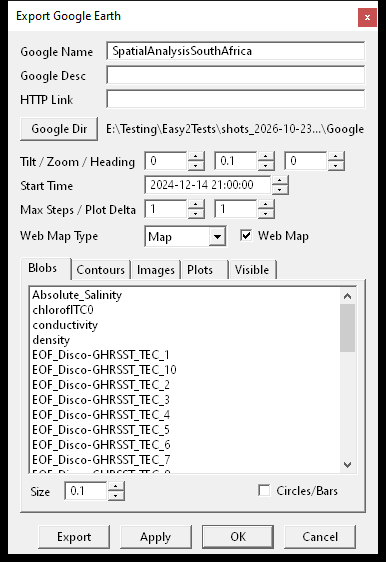
EASy2 exports a project's stations, contours, images and plots to Google Earth, with a time slider for a series. The same export writes an interactive web map: a page that opens in any web browser, with the same layers over a street, satellite or hybrid map, a list to turn each one on and off, and a time slider. The page can be sent to a colleague or put on a web site.
Access to spatial and temporal dimensions
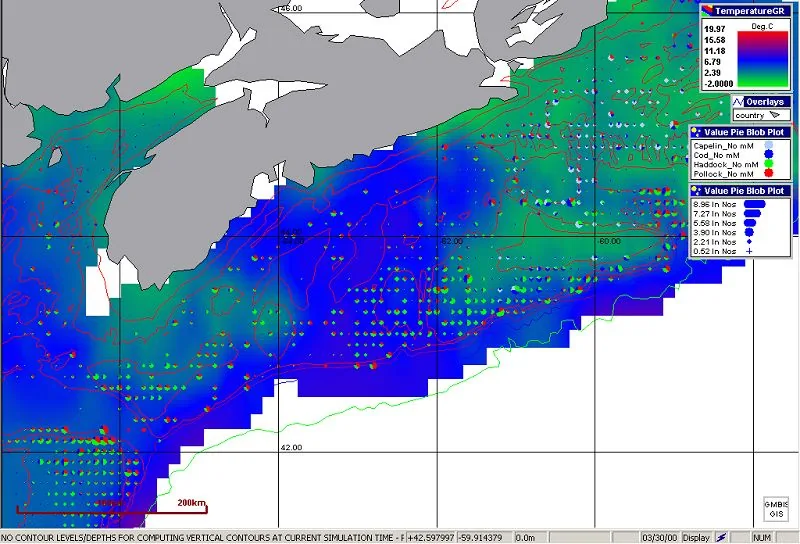
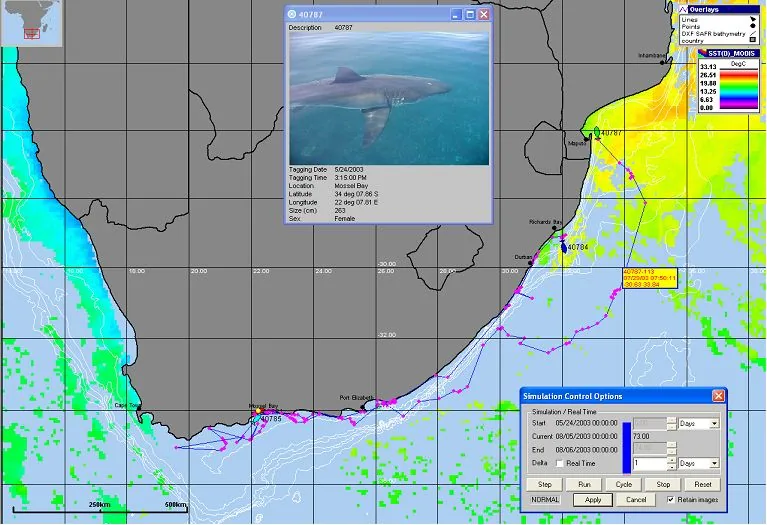
EASy is the dynamic (time-based), 4-dimensional home for data, allowing 2-dimensional (map-based) visualization with interactive drilling and slicing of dynamic 3-dimensional fields. EASy handles both historical and real-time data streams. It graphically renders dynamically in time, within their proper geo-spatial context, both field and remotely sensed data and model outputs as diverse types of plots, including vector, contour, and false color image plots. Vertical structure of data, critical in oceanographic applications, is depicted as vertical contours for user-defined transects or depth profiles at selected point locations. Time series of measurements, and dependencies between data at individual stations can also be visualized interactively as XY-plots.
Relational database-driven environment
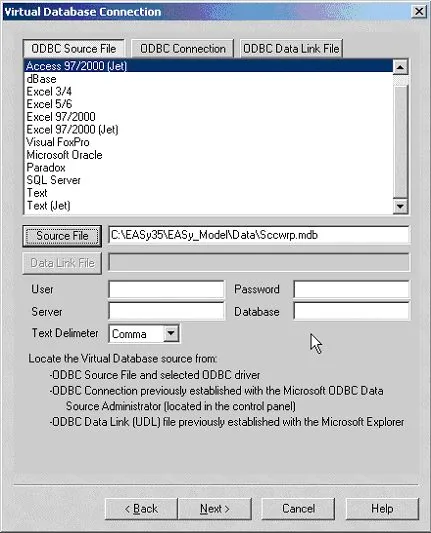
Each EASy2 project keeps its measurements, stations, image catalog and settings in one database file, so projects of millions of measurements open and animate quickly. The Database Wizard brings in data from text files, Excel workbooks and, through ODBC, from relational databases such as Access and SQL Server, and saved imports can be run again on new files.
Advanced modeling functionality and data analysis tools
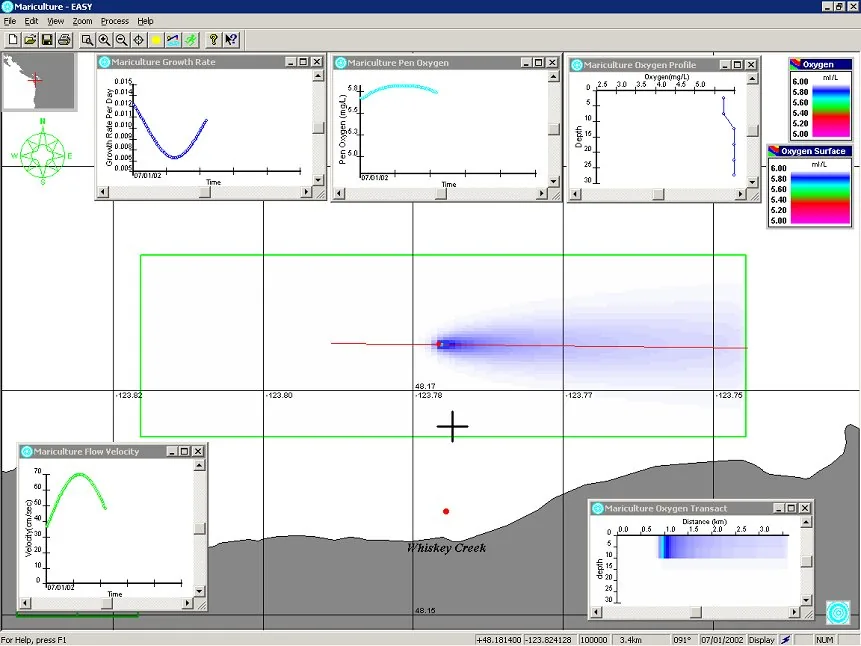
EASy has been custom designed with the particularities of oceanographic applications, the needs of marine research and educational communities, and pathways for information exchange in mind. It facilitates interfacing of multivariate oceanographic data, including satellite imagery with statistical algorithms and mechanistic models. Moreover, EASy has a built-in contouring package for creation of contour plots and false color images.
Models and analysis tools are added to EASy2 as plug-ins, such as AquaModel, Spatial Analysis and the Drifter. EASy2 also finds the main patterns of change in a series of images (EOF analysis), averages daily images into monthly or seasonal ones, and gives the statistics of any part of an image. Images, measurements and model results export as CSV, NetCDF and GeoTIFF, which the "R" statistical package, Python and other GIS software read.
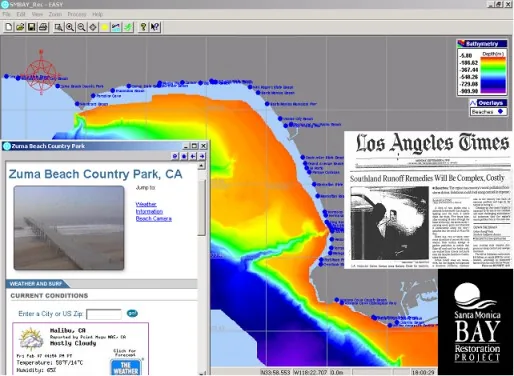
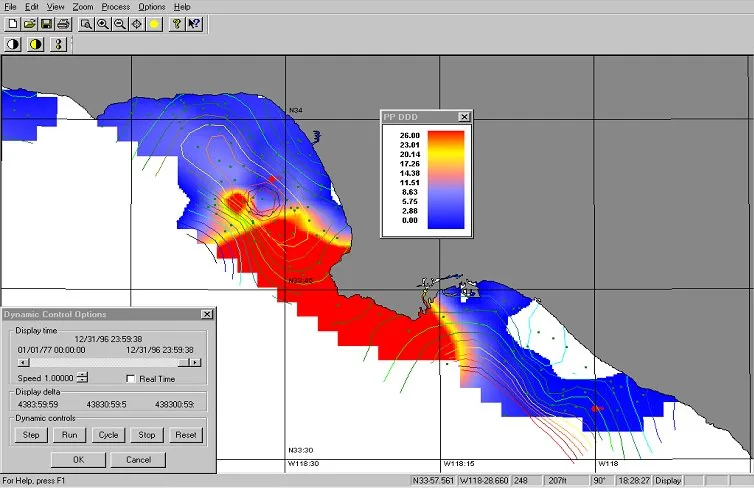
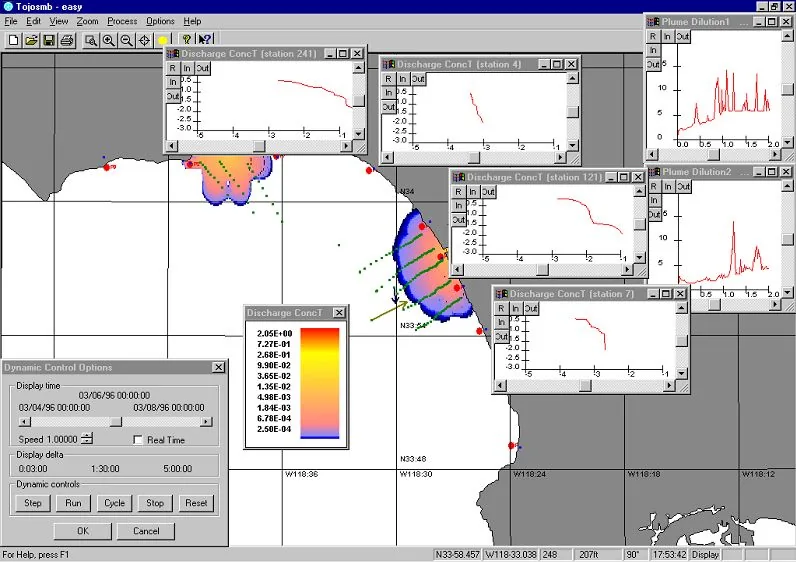
EASy supports advanced modeling with additional customized modules. You can also bring in your models and interface with EASy. Here EASy runs a storm water runoff model for Santa Monica.
Handles a wide variety of oceanographic data formats
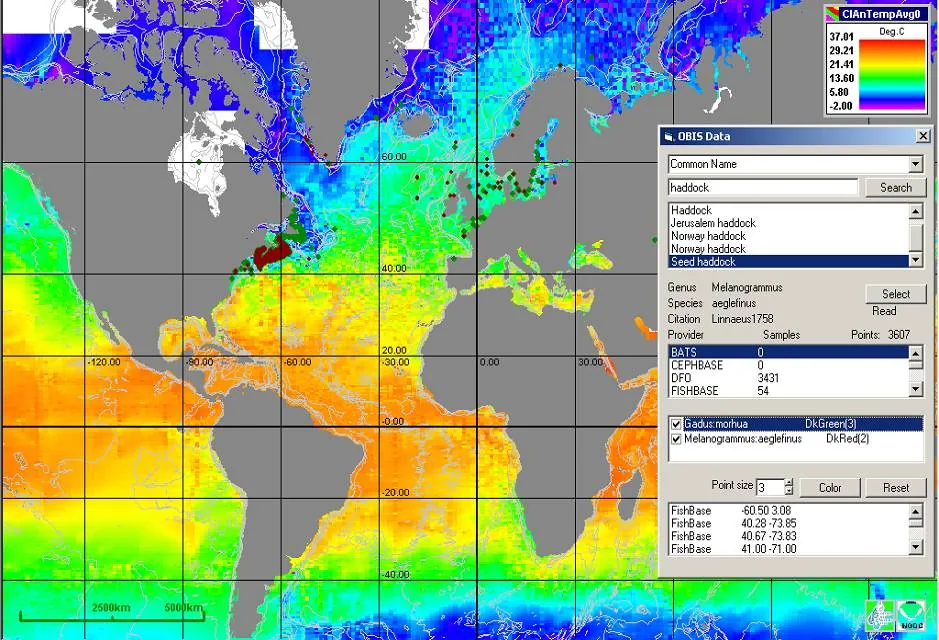
EASy2 reads satellite and ocean model imagery in NetCDF, HDF4, HDF5 and GeoTIFF, model output on curved grids, and the mesh output of FVCOM and DHI MIKE models. It reads vector overlays from shapefiles, so most data from other types of GIS software (such as ESRI's products) can be imported. It also features advanced automated downloading of new data sets, such as daily satellite imagery. More about imagery
EASy can handle a variety of file formats without requiring any plug-ins, and EASy can integrate pictures and sounds with the places on the map: ideal for education and public outreach programs.